Posts

Introduction to Python!

  We all have used calculators at university for math calculations, used GPS when we are located in an unknown place, asked our phone assistance to play some music from youtube, etc. But, do you know how all these wonderful things were created? Thanks to programming! Today, having knowledge of programming is very valuable no matter the background you have. It helps you better understand our today's technological world. There are several programming languages such as JavaScript, C++, Matlab, Python, and so on. All these languages use a similar syntax in terms of coding. If you have never heard about what programming is, or have heard about it, but never used any programming language before, I strongly recommend you to start with Python. Its simplicity will make you feel very comfortable and you will love coding.  On this page, I will show you some interesting and useful applications in Python. In case you have no knowledge of programming, I suggest you to go through the beginne...

Python Machine Learning: Linear Regression (II)

Image
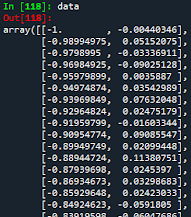
 In the previous tutorial, you have learned how to build a linear regression using matrix multiplication (please go to  Python Machine Learning: Linear Regression (I) ). Now, in this tutorial, a Machine Learning Python library called scikit-learn will be used for this purpose.  Once we have imported the data from the text file, let's set our x- and y-values.  #Importing libraries import numpy as np #Importing text file data = np.loadtxt('points.txt', skiprows=(2), dtype=float) print(data) #Setting x values x = data[:,0] print(x) #Setting y values y = data[:,1] print(y) From the figure above (an extract of the whole data), we can notice that x and y are 1D array . If we want to work with the  scikit-learn  Machine Learning Python library, it is necessary to convert our 1D arrays into 2D. For this, the function reshape(-1,1) . #Reshaping the array into a vector-column x2 = data[:,0].reshape(-1,1) print(x2) #Reshaping the array into a vector-column y2 = data...

Python Machine Learning: Linear Regression (I)

Image
Have you ever felt your phone hears your conversation? For example, you and your friend are talking about new shoes, and then when you pick your phone up, you get a bunch of ads about it? Or, when you watch a movie or series on Netflix, the next time you get recommendations of your taste?  Well, this all is possible thanks to Machine Learning! If you have not heard about it, let me explain it to you. Machine Learning is a very popular topic nowadays. It is a method to analyze data in analytical performance. Machine Learning helps humans with very complicated topics, such as forecasting bitcoin price. In machine learning, the AI model learns from data, analyzes it, and, then, establishes patterns to make future decisions. In this and in the following tutorials, you will learn the basics of Machine Learning using Python. In this tutorial, linear regression will be explained. Before we start coding, what is linear regression? Well, linear regression is an algorithm where the predicted...

Python: Numpy array data manipulation

Image
  In the previous tutorial (please go to  Python: Pandas DataFrame data manipulation ) , one method to manipulate a huge amount of data was explained. Now, in this tutorial, the second method of data manipulation will be explained. In this method, the library numpy is used which sorts data into arrays .  But...what is an array ? An array is a data structure used to store data. To understand it better, let's remember what a matrix is. A matrix is a rectangular (sometimes square) array arranged in rows and columns. An example of a rectangular matrix can be the following: 1 2 3 4 5 6 7 8 As seen above, the matrix has 2 rows and 4 columns. In other words, it has dimensions 2x4. In case the number of rows and columns are the same, the matrix becomes square. In programming, if the matrix has only one row, it is commonly known as a row-vector, and if it has only one column, it is a column-vector. You can get one specific element of the matrix by knowing its position. ...

Python: Plotting data containing date format

Image
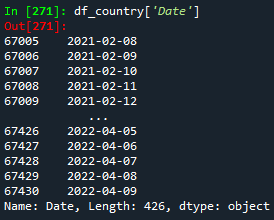
 In the previous tutorial (please go to Python: Pandas DataFrame data manipulation ), you learned how to manipulate a huge amount of data. You learned how to import a text file, how to copy a DataFrame to another, how to remove one or several columns and rows, as well as, how to get data according to a certain condition. Before we start, I will just write the needed Python code for this exercise from the previous one. #Importing library import pandas as pd #Getting data from the text file df = pd.read_csv('vaccinations.txt', header = None, skiprows = (1), sep = ',', quotechar = None, quoting = 3) df.columns = ['Country','Country iso code','Date','Total vaccinations', 'People vaccinated','People                         fully vaccinated','Total boosters','Daily vaccinations raw', 'Daily vaccinations','Total                         vaccinations per hundred'...

Python: Pandas DataFrame data manipulation

Image
 There are some ways to manipulate data in Python. One method is using the library p andas for DataFrame and another method is using another library named numpy for array. In this section, you will learn data manipulation using DataFrame. The library  p andas allows visualizing a vast amount of data in a very nice way. You are able to work with data that looks like data in any Excel sheet. For this exercise, we will use the text file named 'vaccinations.txt' from the previous exercise. Let's get started! Just to remind you, in the previous tutorial (please go to Python: Downloading data from the web ) , we downloaded a file from the web, reading line by line, and finally, created a text file named 'vaccinations.txt', containing a vast amount of  data about covid vaccination in the world. This file will be used in this exercise. A very short part of it looks like this: As seen from the figure above, the columns are separated by the  'comma' (',') deli...