Python: Pandas DataFrame data manipulation
There are some ways to manipulate data in Python. One method is using the library pandas for DataFrame and another method is using another library named numpy for array. In this section, you will learn data manipulation using DataFrame.
The library pandas allows visualizing a vast amount of data in a very nice way. You are able to work with data that looks like data in any Excel sheet. For this exercise, we will use the text file named 'vaccinations.txt' from the previous exercise. Let's get started!
Just to remind you, in the previous tutorial (please go to Python: Downloading data from the web), we downloaded a file from the web, reading line by line, and finally, created a text file named 'vaccinations.txt', containing a vast amount of data about covid vaccination in the world. This file will be used in this exercise. A very short part of it looks like this:
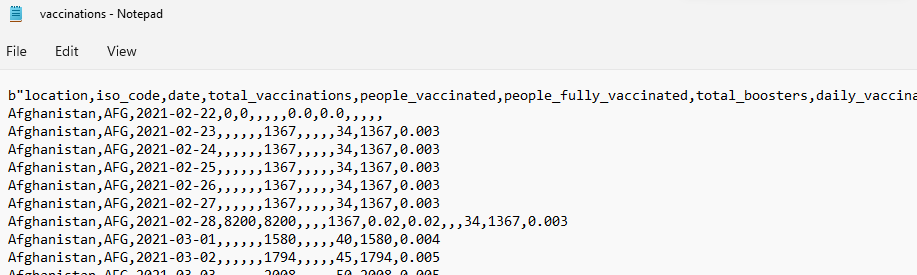
As seen from the figure above, the columns are separated by the 'comma' (',') delimiter. Even though the text file has a header (the first row), we will write our own row header with different names. Then, first of all, the text file should be imported into Python using the Python function pd.read_csv. Do not forget to import the pandas library.
#Importing library
import pandas as pd
#Importing the text file
df = pd.read_csv('vaccinations.txt', header = None, skiprows = (1), sep = ',', quotechar = None, quoting = 3)
#Printing the DataFrame
print(df)
Please note that when importing the pandas library, we give it the nickname 'pd'. This helps to make the code shorter every time we call it. If you do not give a nickname to the imported library, then you should write:
df = pandas.read_csv('vaccinations.txt', header = None, skiprows = (1), sep = ',', quotechar = None, quoting = 3).

Since the file has a lot of rows, we can display either the first five or the last five rows by typing:
#Getting the 5 first rows of the DataFrame
df.head()
#Getting the 5 last rows of the DataFrame
df.tail()
.png)
.png)
Now, we will create our own header.
#Setting a header for the DataFrame
df.columns = ['Country','Country iso code','Date','Total vaccinations','People vaccinated','People fully vaccinated','Total boosters','Daily vaccinations raw','Daily vaccinations', 'Total vaccinations per hundred','People vaccinated per hundred','People fully vaccinated per hundred','Total boosters per hundred','Daily vaccinations per million','Daily people vaccinated','Daily people vaccinated per hundred']

We can also make a copy of the DataFrame in order not to modify the original DataFrame.
#Copying the DataFrame to another DataFrame
df_copy = df.copy()
print(df_copy)
Now, it is time to show you how we can remove one or several columns. For this, we will use 2 methods: the first one with the function del, and the second one using the function drop. If using the second method, we can delete the columns by either axis or column parameter.
#del function for removing one column only
del df_copy['Daily vaccinations']
print(df_copy)

#drop() function for removing one or more columns
#Method 1: Using axis parameter
df_copy_drop1 = df_copy.drop(['Total vaccinations','People vaccinated','Country iso code'], axis=1)
print(df_copy_drop1)
#Method 2: Using columns parameter
df_copy_drop2 = df_copy.drop(columns=['Total vaccinations','People vaccinated','Country iso code'])
print(df_copy_drop2)


Please notice that the original DataFrame df has 16 columns. When using the del function, the DataFrame df_copy has 15 columns. If using the drop function either by axis or column parameter, we get the same output: a DataFrame with 12 columns.
In a similar way, it is also possible to delete one or more rows from the DataFrame. For this, we will use the function drop.
#Deleting one or several rows
df_copy_drop = df_copy.drop([100, 525, 9461], axis=0)
Printing the DataFrame
print(df_copy_drop)

Please notice that the DataFrame df_copy_drop has 3 rows less (94262 rows) than the DataFrame df_copy (94265). It is also important to keep in mind that when we use the function drop, axis=0 stands for removing rows, while axis=1 stands for columns.
Now, we will get certain rows from the original DataFrame df according to a certain condition. For example, we can get the data per country. For this, we will use the input function.
#Getting data per country
country = input('Please type your country of interest:')
df_country = df[df['Country'] == country]
print(df_country)

As seen, once the user enters the desired country, Python automatically outputs the data for this specific country. Note that the country name to be inputted should be in the text file, otherwise, you will get an error, because Python will not find any row with your input.
Just as Python can import a file, Python is also capable of exporting the DataFrame to an Excel file. To finalize this exercise, I will show you how this can be done.
#Exporting DataFrame to Excel
excel_file = df_country.to_excel('Vaccinations by country.xlsx')
If you go to the folder where your Python script is saved, then the exported Excel file can be found.

The final Python code will look like this:

Congratulations! You just learned how to manipulate a vast amount of data! For the next exercise, we will learn how to plot data with date format.

Comments
Post a Comment