Posts

Showing posts from April, 2022

Python: Numpy array data manipulation

Image
  In the previous tutorial (please go to  Python: Pandas DataFrame data manipulation ) , one method to manipulate a huge amount of data was explained. Now, in this tutorial, the second method of data manipulation will be explained. In this method, the library numpy is used which sorts data into arrays .  But...what is an array ? An array is a data structure used to store data. To understand it better, let's remember what a matrix is. A matrix is a rectangular (sometimes square) array arranged in rows and columns. An example of a rectangular matrix can be the following: 1 2 3 4 5 6 7 8 As seen above, the matrix has 2 rows and 4 columns. In other words, it has dimensions 2x4. In case the number of rows and columns are the same, the matrix becomes square. In programming, if the matrix has only one row, it is commonly known as a row-vector, and if it has only one column, it is a column-vector. You can get one specific element of the matrix by knowing its position. For exampl

Python: Plotting data containing date format

Image
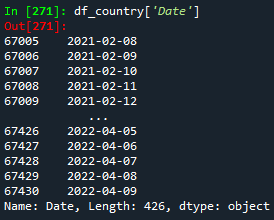
 In the previous tutorial (please go to Python: Pandas DataFrame data manipulation ), you learned how to manipulate a huge amount of data. You learned how to import a text file, how to copy a DataFrame to another, how to remove one or several columns and rows, as well as, how to get data according to a certain condition. Before we start, I will just write the needed Python code for this exercise from the previous one. #Importing library import pandas as pd #Getting data from the text file df = pd.read_csv('vaccinations.txt', header = None, skiprows = (1), sep = ',', quotechar = None, quoting = 3) df.columns = ['Country','Country iso code','Date','Total vaccinations', 'People vaccinated','People                         fully vaccinated','Total boosters','Daily vaccinations raw', 'Daily vaccinations','Total                         vaccinations per hundred','People vaccinated per hundred

Python: Pandas DataFrame data manipulation

Image
 There are some ways to manipulate data in Python. One method is using the library p andas for DataFrame and another method is using another library named numpy for array. In this section, you will learn data manipulation using DataFrame. The library  p andas allows visualizing a vast amount of data in a very nice way. You are able to work with data that looks like data in any Excel sheet. For this exercise, we will use the text file named 'vaccinations.txt' from the previous exercise. Let's get started! Just to remind you, in the previous tutorial (please go to Python: Downloading data from the web ) , we downloaded a file from the web, reading line by line, and finally, created a text file named 'vaccinations.txt', containing a vast amount of  data about covid vaccination in the world. This file will be used in this exercise. A very short part of it looks like this: As seen from the figure above, the columns are separated by the  'comma' (',') deli

Python: Downloading data from the web

Image
 Are you tired of going to the browser, downloading the data you want, and then saving it to your desired folder? Well, here is your solution! You can download the data from the web using Python! Let everything be automated! Let's get started! The data used for this tutorial was downloaded from the following source: https://github.com/owid/covid-19-data/blob/master/public/data/vaccinations/vaccinations.csv. After you have searched your file on the web (it can be any file from any web), the first thing you should do is to right-click on the file and copy its link address as shown in the figure below. Now, go to your Python file and paste this link address of the file in order to read and download the file. For this purpose, since we are working with a link address, we have to import the request library from the urllib library. #Importing libraries from urllib import request #Reading the file from the link file_url = r'https://github.com/owid/covid-19-data/blob/master/public/da

Python: Tracking any phone number

Image
 Did you know Python is capable of getting the location of any person just by knowing his/her phone number? In this exercise, we will see how this is possible. Once again, this tutorial is only for educational and entertainment purposes. The libraries geocoder , and carrier libraries from the  phonenumbers  library should be imported. These libraries will help with the purpose of this exercise. Let's start! import phonenumbers from phonenumbers import geocoder from phonenumbers import carrier #Introducing the phone number to be tracked number = '+51 XXXXXXXXX' phone_number = phonenumbers.parse(number) carrier = carrier.name_for_number(phone_number, 'es') region = geocoder.description_for_number(phone_number,'es') As seen from the pictures, Python can output the name of the region in any language. If you want, for example, in English, you write 'en' instead of 'es', or 'de' for German, or 'ru' for Russian. The output of the va

Python: Drawing a heart

Image
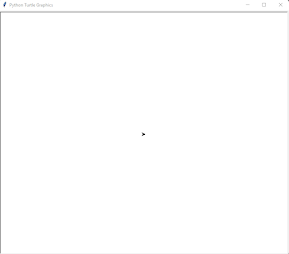
 In Python, there is a library called turtle. It is used for drawing pictures in a very nice way. In this exercise, this library will be used to draw a perfect heart with "I love you" inside. Let's see a brief explanation about the turtle library. from turtle import * getscreen() As you can see from the figure above, in Python turtle is the cursor shown in the middle of the screen. Its position is x = 0 and y = 0. Notice that the turtle is pointing to the right, meaning if we want it to move forward in the same direction, we need to write the function forward(). It is also possible to change the screen background color. #Choosing the background-color bgcolor('light blue') #Moving the turtle forward forward(100) As seen, the turtle has been moved 100 pixels in the same direction it was pointing initially (to the right). Now, if we want the turtle to point out in a different direction and move in that direction, we should write: #Turning the turtle to the left at